Learn How to Audit & View and Individual Well
MineralTracker allows you to break down your mineral portfolio to analyze each well you own. This information is useful for you to see which wells are your highest performing wells, the operators of those wells, and a historical view of that individual well’s production.
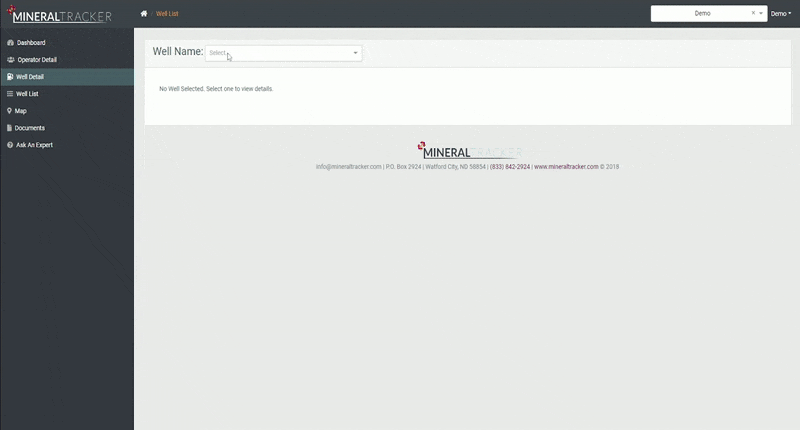
- Begin by clicking Well Detail in the left menu ribbon. This will take you to a menu where you can search for a well to analyze.
- Find the particular well in question in the Well Name drop-down box. Click the down arrow to scroll through your wells or begin typing its name in the box.
- Selecting a well will open up that well’s dashboard. This contains critical information about the well, and you can view the well’s Operator, Status and Date, IP Date, Cumulative Oil, Owner Decimal Interest, Township, Range, Section, QQ, Working Interest.
- Below the well detail are two boxes that display your Estimate Past Income and Projected Income (Pro Plan only).
Est. Past Income shows what MineralTracker estimated you should have received in the past from your interest in this specific well. You can compare this value with what you were actually paid by the oil company for this well to learn if you were being paid accurately and fairly for this well’s minerals.
Projected Income (Pro Plan only) shows the projected future income for this particular well. MineralTracker’s petroleum engineers calculate this number based upon current market prices, your owner decimal interest, and MineralTracker’s analysis of the reservoir.
- The top right corner of the Well Detail dashboard shows an income graph similar to the graph on the main dashboard. This graph shows the estimated past income and projected income (Pro Plan only) for that well.
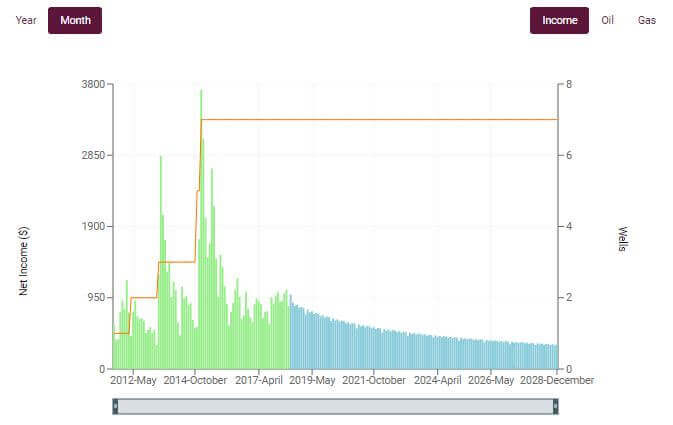
The sections of the graph:
- The green bars show estimated past income for your wells. Hover your mouse over the bars to open the dialogue box displaying expanded well information.
- The blue bars show the projected income for that well. Hover your mouse above the bar to see that month in detail.
The features of the graph:
- Drag the slider bar below the graph to expand or shorten the timeline.
- Click Oil or Gas to view your income from each of the commodities.
- Scroll down to view the interactive map. This map displays all your wells, other operating wells, permitted wells, drilling rigs, and also the horizontal legs of the wells. You can use this graph to see how your well is positioned in relation to other wells.
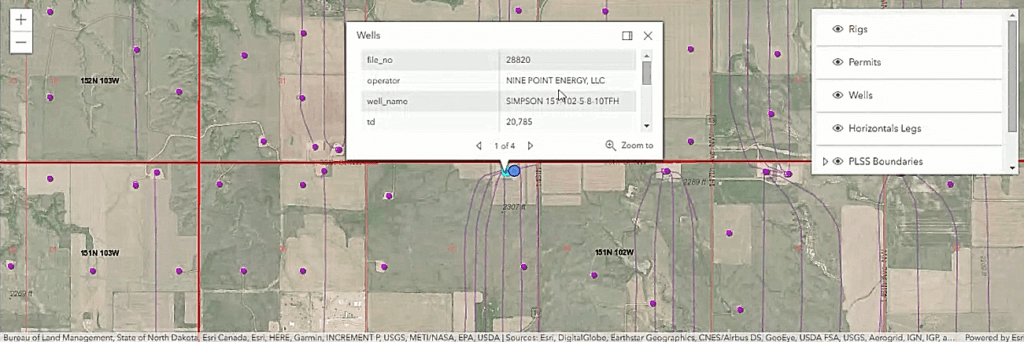
The map legend:
- The blue dot is the individual well in which your hold an interest. Clicking on the blue dot will open a dialogue box with expanded well info where you can see the operator, well name, and other information.
- Black dots are drilling rigs. This allows you to see where new wells are being developed.
- The purple dots are other wells that you do not have an interest in. You can also click on these wells to view information about these wells like operators, well names, locations and more.
- Take notice of the purple lines. Purple lines are the well laterals. Viewing these well laterals helps you understand future development.
- At the bottom of the page is a text box where you can leave notes.