Learn How to Review your Dashboard
The MineralTracker Dashboard displays an overview of your mineral assets. The Dashboard shows everything that you own, all operators and all wells. Here, you can begin to analyze previous revenue and predict future income (Pro Plan only). Follow these steps below as you work your way downward through the MineralTracker Dashboard to understand the different sections and what they show.
- The top section contains your current well status. You will see the status of the different wells that you entered, including your Active Wells, Inactive Wells, Confidential, Non-Completed Wells, Permitted Wells, and Abandoned.
- Moving down, find your high-level income information.
- The top blocks contain the estimated past monthly income based on market prices and reported production, and with the Pro Plan, projected monthly income that MineralTracker’s petroleum engineers calculated based on MineralTracker’s analysis of the reservoir, your decimal interest, and market prices. This information will give you an idea of how your minerals are currently performing. The bottom blocks display the past year-to-date’s estimated income and with the Pro Plan, the annual projected income. These blocks give you an overview of how your minerals are performing longer term. The current year’s annual projected income helps you prepare for your financial future by answering questions like:
- Will my minerals support me and my family?
- Can I retire on this income?
- Can I cover future purchases and expenses with my minerals?
- The bar graph to the right of the blocks displays your mineral income. This powerful tool allows you to analyze your income on a monthly or yearly basis.
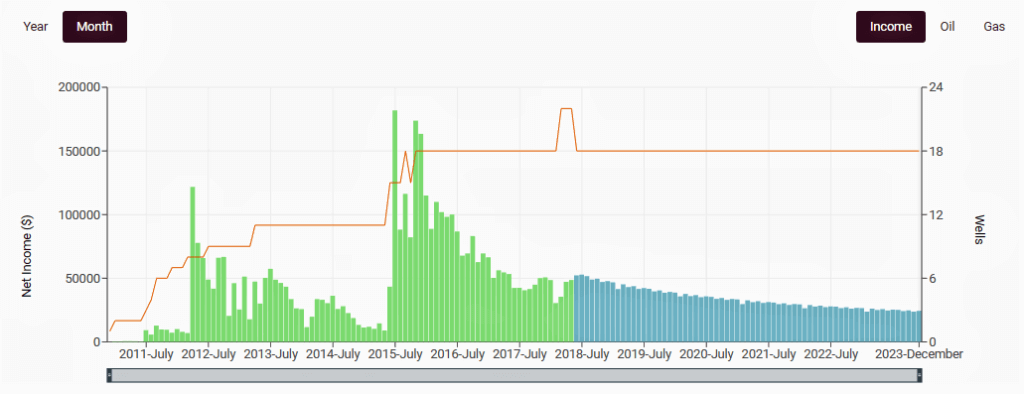 The sections of the graph:
- The green bars show historic estimates of what your past royalty revenue.
- The blue bars on the right side of the graph represent estimated future income for Pro Plan users.
Features of the graph:
- Hover your mouse above different bars to see information like past and projected income from a specific month.
- Click the Year button in the left corner to view your income information on a yearly basis.
- The orange line represents your well count. This will rise and fall based upon the number of wells you own.
- Select Oil and Gas in the upper right corner to filter the graph to only display income from the specific products.
- Click and drag the bottom slider-bar to change the time range period to analyze shorter or longer periods of time.
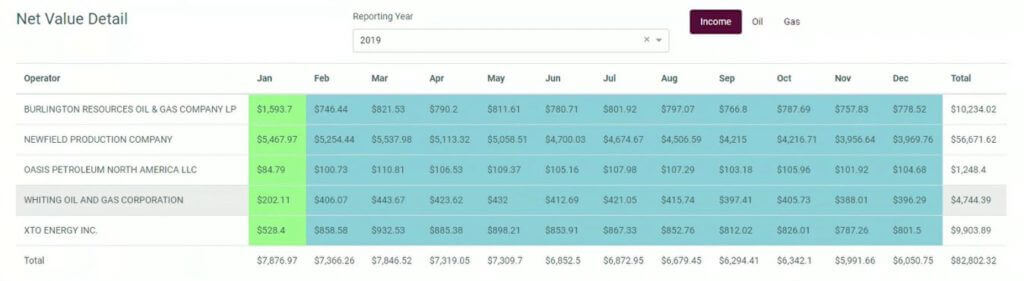
- Scroll down to the Net Value Detail This section breaks down your mineral portfolio by operator and displays your income month to month in a chosen year. The green boxes show a historic estimate of your royalty payments. The blue boxes are future payment forecasts for Pro Plan users.
- Scrolling down further, you will find a pie graph displaying the operators of your wells. This graph is helpful for you to see exactly who is operating your wells and the proportion of your total revenue each generates.
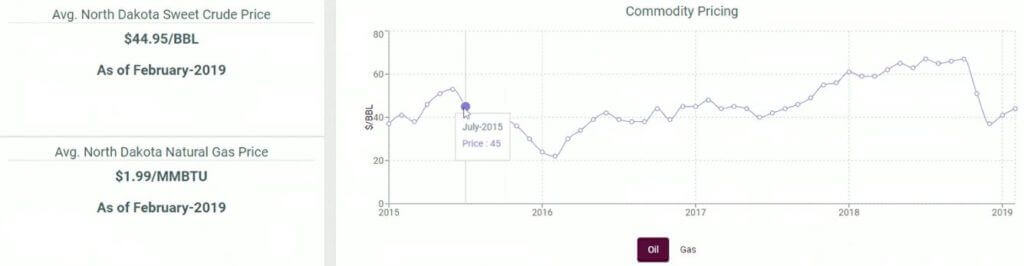
- Scroll down to the final section at the bottom of the page. This section shows the average crude oil and natural gas prices from the Energy Information Administration. MineralTracker uses this information to calculate your future revenue projections. This helps you to see pricing trends and activity.