Learn How to Understand the Future
Your MineralTracker dashboard displays information about your wells in a useful way that helps you to understand your portfolio and plan for the future. Our petroleum engineers calculated your predicted future income from your minerals and display it on an interactive map.
With MineralTracker, you can ‘see’ into the future to predict income from your minerals and plan for things like retirement, children’s education, loans payments and more. Use the tools in your MineralTracker subscription to break down your asset and understand your future.
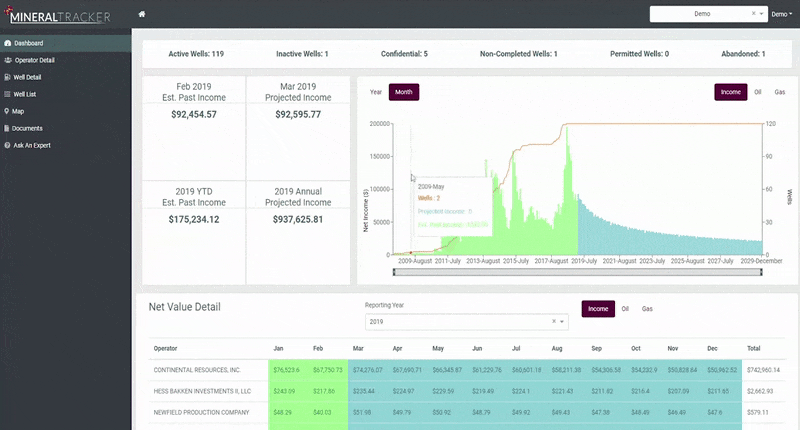
- Go to the top section of your MineralTracker dashboard and view the graph. This powerful tool allows you to analyze income from your entire mineral portfolio on a monthly or yearly basis and see past and projected income estimates.
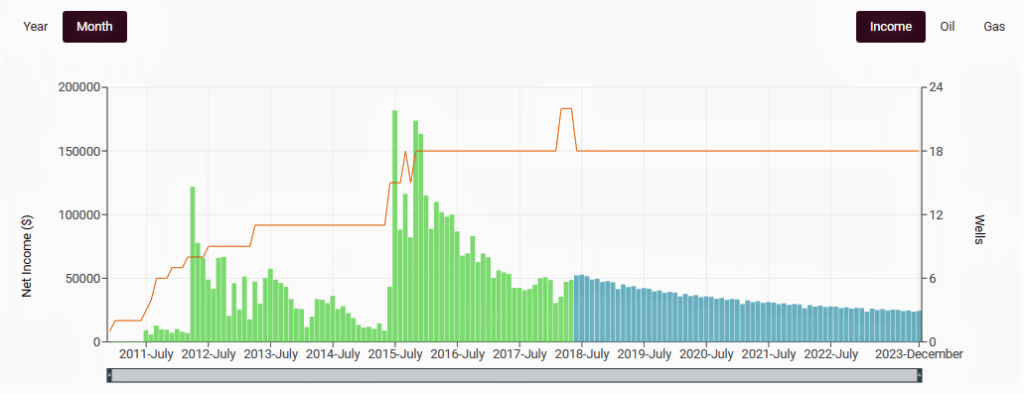
The sections of the graph:
- The green bars show historic estimates of what your revenue should have looked like. These prices are based on historic North Dakota sweet crude prices.
- The blue bars on the right side of the graph represent estimated future income from your wells. Future income predictions are calculated by MineralTracker’s petroleum engineers and are based on current commodity prices. The blue bars help you to ‘see into the future’ and understand how much you could be making with your current mineral interests. Adding and removing wells in the Well List page or changing your decimal interest will change these projections.
- The orange line represents your well count and will rise and drop based upon the number of wells you own.
The features of the graph:
- Hover your mouse above different bars to see information about that specific month. A box will appear showing the well count of that month, the past income to date, and projected income from that month.
- Click the Year button in the left corner to view your income information on a yearly basis.
- Select Oil and Gas in the upper right corner to filter the graph and display only your income from the specific products.
- Click and drag the bottom slider-bar to change the time range period to analyze shorter or longer periods of time. This allows you to expand a period of time and see an in-depth view of your income activity. You can go back in time to when your first well began producing or as far back as the year 2000.
This graph automatically updates when you add or remove wells in the Add a Well feature so you will always have a current view of your portfolio.
Use this tool to predict what future royalty income will be for your mineral interests. If you have questions, contact MineralTracker through the Ask an Expert feature. Our expert team will work with you to understand what your information means and how to interpret it.